HomeProjectsCommunity Based Surveillance platform

Community Based Surveillance platform

The Community Based Surveillance platform supports collection, management and monitoring of health-related information reported by communities and frontline volunteers, connecting it with response teams for faster follow-up.

The Community Based Surveillance platform supports collection, management and monitoring of health-related information reported by communities and frontline volunteers, connecting it with response teams for faster follow-up.

01The Challenge

The Problem Statement

Communities and frontline volunteers are often the first to notice health events. Before the Community Based Surveillance platform, this information was collected through manual, fragmented processes. This made it hard to consolidate reports for follow-up. When reports are scattered, it is difficult to see what is being reported, where it is coming from and whether it has been followed up. The Society needed one system for collecting, managing and monitoring health-related information reported by communities and frontline volunteers, and for connecting it with response teams.

02The Solution

The Solution

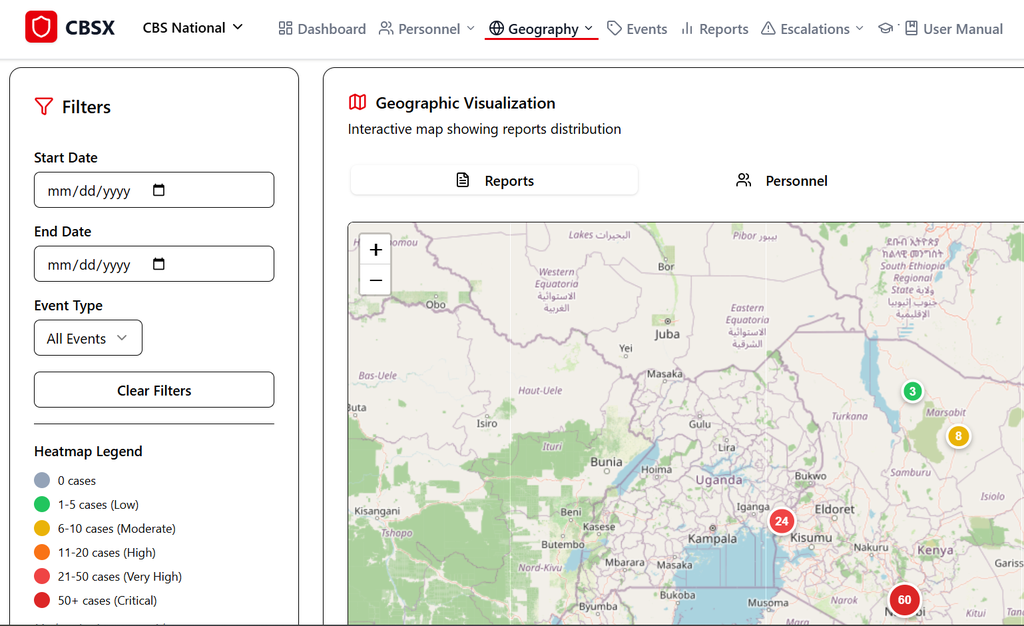
The Community Based Surveillance platform (CBS) supports the collection, management and monitoring of health-related information reported by communities and frontline volunteers. It connects this information with response teams for faster follow-up. Volunteers submit alerts, and designated teams review, manage and follow up on the reports through a structured workflow. Volunteers can report and track health events through CBS Mobile, a mobile version of the platform. Teams work from the web platform, which has sections for the Dashboard, Personnel, Geography, Events, Reports and Escalations, along with a User Manual. The platform can be viewed at national level through the CBS National view. The Geography section gives teams an interactive map showing the distribution of reports. The map can be switched between Reports and Personnel, and filtered by start date, end date and event type. A heatmap legend groups areas by the number of cases, from 0 cases and Low (1-5), through Moderate (6-10), High (11-20) and Very High (21-50), to Critical (50+). This lets teams see where reporting is concentrated.

03Impact

The Impact

The platform strengthened community-level disease and event reporting. With reports collected and followed up through one structured workflow, instead of manual and fragmented processes, response teams are better placed to act. This supports a faster, better-coordinated response to emerging health risks.